k-NN (k-Nearest Neighbors) in Supervised Machine Learning

K-nearest neighbors (k-NN) is a Machine Learning algorithm for supervised machine learning type. It is used for both regression and classification tasks.
As we already know, a supervised machine learning algorithm depends on labeled input data, which the algorithm learns to produce accurate outputs when input unlabeled data.
k-NN aims to predict the test data set by calculating the distance between the current training data points. It assumes that similar things exist within proximity.
KNN vs. K-means
k-NN and K-means sound very similar and often get confused. However, they are different. K-means is an unsupervised learning algorithm that is used for clustering. In contrast, k-NN is a supervised learning algorithm used for classification.
Check the article about K-means clustering if you would like to know more.
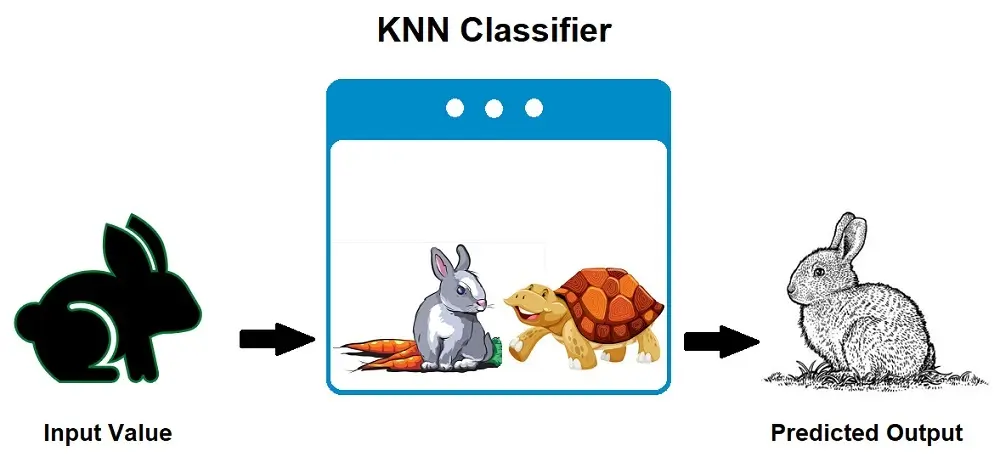
Why Do We Need k-Nearest Neighbor?
k-Nearest Neighbors or k-NN algorithm is used for classification tasks. For example, if we take the image above. Suppose we have two categories: a rabbit and a tortoise. If we input a new data point (an image), this data point will fall into one of these categories.
To determine which category this new input image belongs to, we use k-NN. The k-Nearest Neighbors algorithm allows us to identify the category to which the new data point belongs.
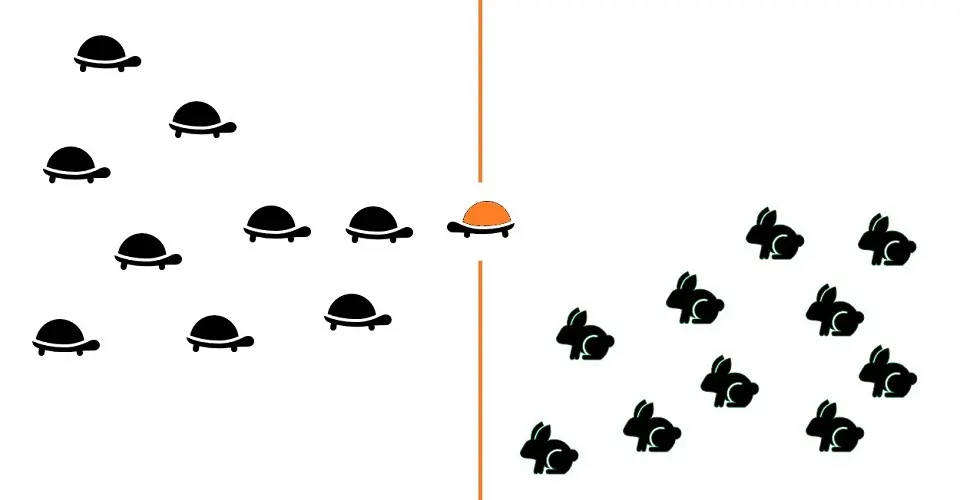
The k-NN algorithm will take into consideration the characteristics of the new inputs. The tortoise does not have visible ears like a rabbit in this example. Like all mammals, a rabbit has hair, while a tortoise has a hard shell. In addition, rabbits hop and run faster than most house cats can run. In contrast, a tortoise moves very slowly.
Based on these characteristics or features of the new input, the k-Nearest Neighbors algorithm will place the new data input closer to the category that shares the same characteristics or features.
The following image shows a new input image (brown tortoise) closer to the tortoise’s category.
Overall, k-NN is one of the simplest algorithms used for classification tasks. It learns all data points’ characteristics and stores them to classify new data points based on similar characteristics.
Before I go into how the k-NN algorithm works, understanding the importance of the k-value and how to calculate the distance between data points is vital to your overall grasp of k-NN.
The “k” in k-Nearest Neighbors
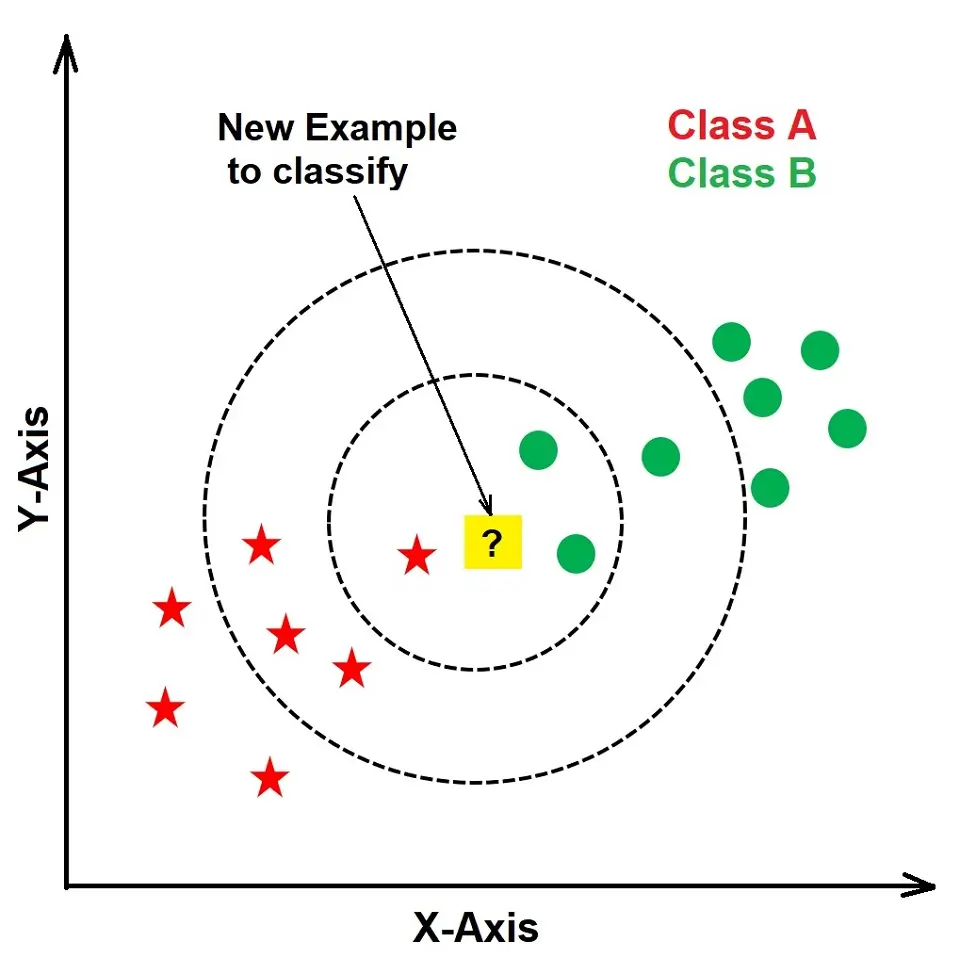
The “k” in k-Nearest Neighbors is a parameter that refers to the number of nearest neighbors. K is a positive integer that is typically small in value. For example, if k = 2, the object or data point is assigned to the Class of that nearest neighbor.
Let’s use an example. I have just moved to a new neighborhood and am looking for friends within the area. I found five friends I could potentially be close friends with due to characteristics, hobbies, lifestyle, etc. In this case, k = 5, and I am the new data point.
When I am added to the algorithm, it will use my characteristics and take the k nearest neighbors to help decide which of these five potential friends are very similar to me and which ones aren’t.
The image below explains the importance of the k-value in k-NN. If we use k=3, the new data point will belong to Class B as more current data points are within k=3. However, if we choose k=7, the new data point will belong to Class A as there are more current Class A data points in k=7.
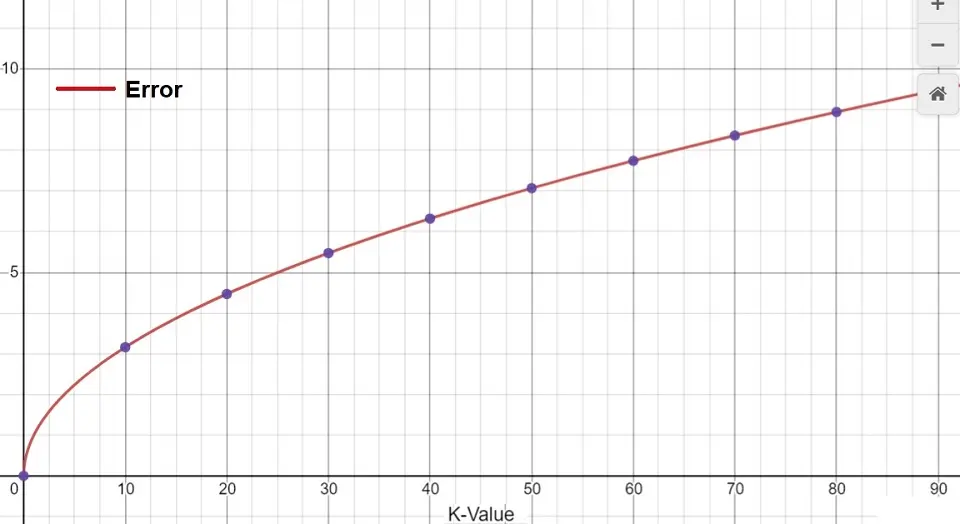
The graph below shows the training error rate against the increase in the value of K:
Calculating the Distance Between the Data Points
To assign a new data point to the correct category/class, calculate the distance between the new data point and the current training data points.
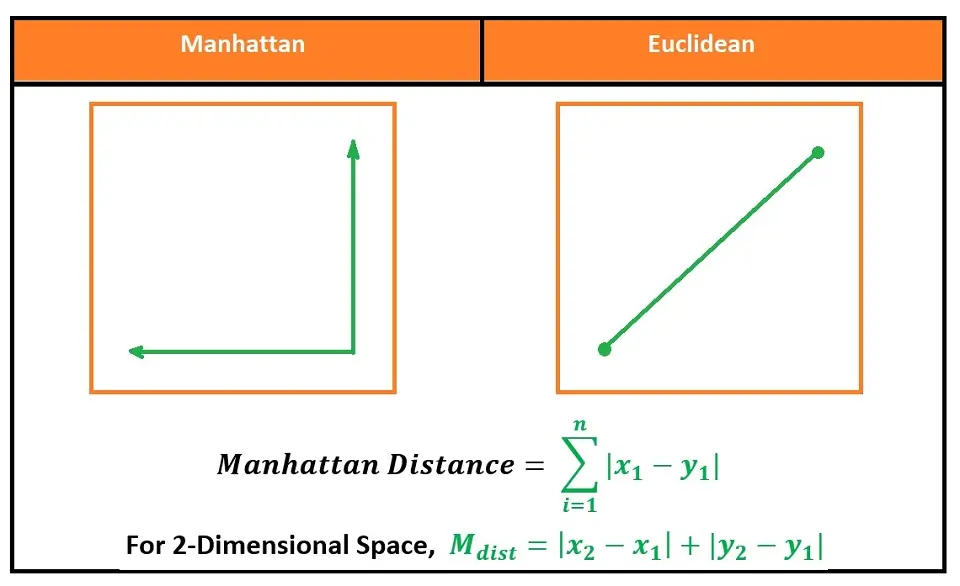
There are different methods you can use to calculate the distance. However, the most common methods used are Euclidian and Manhattan for continuous data and Hamming distance for categorical data.
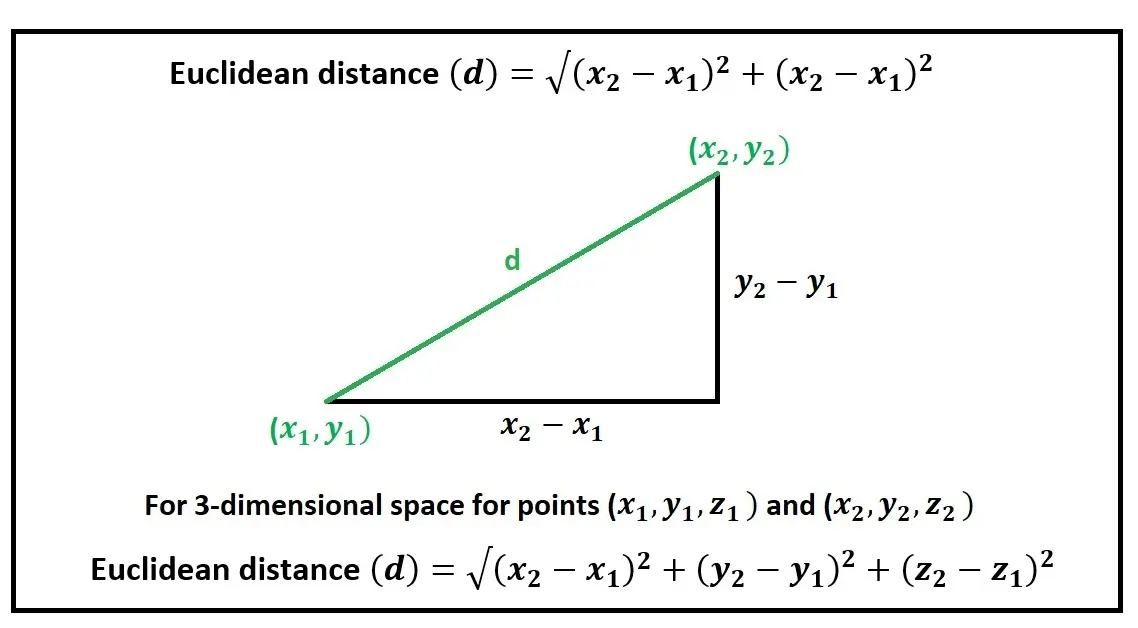
Euclidean Distance is the mathematical distance between two points within Euclidean space using the length of a line between the two points.
The formula is the square root of the sum of the squared differences between a new data point (x) and an existing trained data point (y).
Manhattan Distance, also known as Taxicab geometry, is the mathematical distance between two points, the sum of the absolute difference of their Cartesian coordinates.
The formula is the sum of the lengths between a new data point (x) and an existing trained data point (y) using a line segment on the coordinate axes.
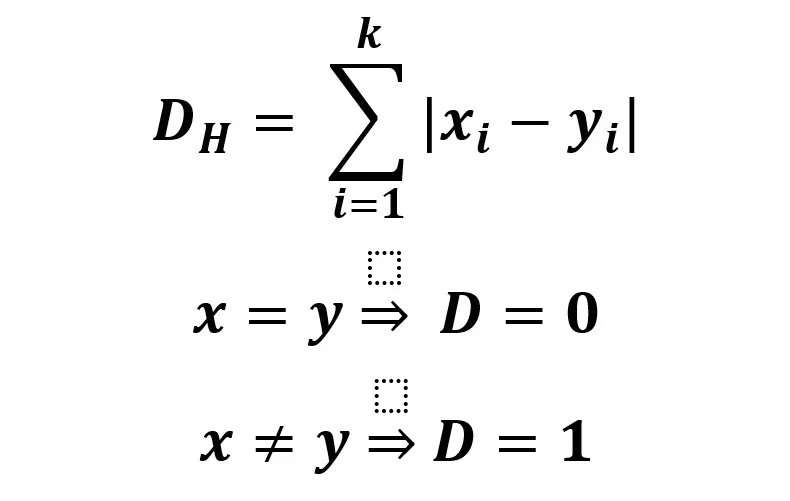
Hamming distance is a metric to compare two binary data strings. Hamming distance uses the number of bit positions where the two bits differ.
The formula is the sum of the value of the new data point (x) minus the value of the existing trained data point (y). If these values are the same, the distance, D, will equal 0.
k-Nearest Neighbors (KNN) Algorithm
Below are the simple steps on how to use a k-NN algorithm:
- Load in your dataset
- Choose a k-value. You should choose an odd number to avoid a tie.
- Find the distance between the new data point and the neighboring existing trained data points.
- Find the K nearest neighbor to the new data point.
The new data point will belong to a category/class with the most neighbors for classification tasks. Therefore, you should count the number of data points among the k neighbors within each category.
For regression tasks, the new data point’s value will be the average of the k neighbors.
k-Nearest Neighbors Implementation:
We can implement k-Nearest Neighbors (k-NN) algorithm in virtually any programming language that supports basic data structures and computation. However, it’s most commonly implemented in languages that are widely used for data analysis and machine learning.
Programming Languages for k-NN Implementation
- Python: Thanks to libraries like scikit-learn, NumPy, and pandas, Python is a popular choice for implementing k-NN. It provides a straightforward syntax and powerful data manipulation capabilities, making it ideal for prototyping and production.
- R: R is another language that we use commonly for statistical analysis and machine learning. The ‘class’ package in R includes a k-NN implementation, and the language’s strong suite of visualization tools can be useful for assessing the results of k-NN models.
- Java: Java may be the choice for applications that require a more robust software architecture. Libraries such as Weka provide machine learning algorithms, including k-NN, that are ready for integration into larger systems.
- MATLAB: MATLAB is a favored choice in academia and engineering for its powerful mathematical toolkit and easy-to-use interface. It has built-in functions for k-NN, making it a good choice for numerical experiments.
- Julia: As a newer language designed for high-performance scientific computing, Julia provides good speed and easy syntax, making it a growing choice for machine learning tasks, including k-NN.
Each language has its strengths, and the choice of language for implementing k-NN would depend on the specific needs of the project, such as speed, ease of use, scalability, and the availability of machine learning libraries.
Implementing k-Nearest Neighbors (k-NN) in Python
Python has several attributes that can make it more suitable than other programming languages for implementing k-Nearest Neighbors (k-NN), particularly for data science and machine learning tasks:
- Rich Ecosystem: Python boasts a vast ecosystem of libraries specifically designed for data science and machine learning, such as scikit-learn, which provides a highly-optimized implementation of k-NN along with tools for pre-processing data, evaluating models, and more.
- Ease of Use: Python’s syntax is clear and readable, making it accessible to beginners and convenient for rapid development. This can be particularly helpful when experimenting with k-NN and testing different parameters.
- Community Support: Python has a large and active community, particularly in the field of machine learning. This means more resources for learning and troubleshooting, as well as a wealth of shared code and best practices.
- Integration with Other Tools: Python integrates seamlessly with other parts of a typical data analysis workflow, such as data extraction and transformation with pandas, data visualization with Matplotlib and Seaborn, and deep learning with TensorFlow or PyTorch.
- Productivity and Speed of Development: Python allows for a quick transition from an experimental phase to a production phase. Additionally, Python’s interpreter and dynamic typing make it well-suited for interactive exploration and iterative testing of machine learning models.
- Platform Independence: Python is cross-platform, which means we can develop and deploy k-NN models on almost any operating system.
- Popularity in Academia and Industry: Due to its widespread use in both research and industry, Python benefits from continuous improvements and contributions in machine learning, ensuring state-of-the-art techniques and algorithms are readily available.
Python may not always be the fastest in terms of execution speed compared to compiled languages like Java or C++.
However, the difference is often mitigated by the use of optimized libraries. Moreover, because in practice, the bottleneck in machine learning tasks is often data I/O or preprocessing rather than the execution speed of the algorithm itself. Moreover, critical parts of code can be implemented in Cython or use Python wrappers for performance-critical code written in C or C++.
Example of Python Code for kNN
Let’s take an example of implementing k_Nearest Neighbor (kNN) in Python for the following objective:
- Regression Task: The regression part of the code is to predict a continuous output. Specifically, it is trying to estimate someone’s weight based on their height. The code needs to include a small dataset of heights and weights. The Python code is to use the k-NN algorithm to predict the weight for a given height (in this case, the height is 60 inches). The average (mean) weight of the k-nearest neighbors (based on height) is to be the predicted weight.
- Classification Task: The classification part of the code is to predict a categorical output. It should use the k-NN algorithm to answer whether a 33-year-old likes pineapple on their pizza, which is a binary classification (1 for ‘yes’, 0 for ‘no’). The code should include a dataset of ages and their corresponding binary preference for pineapple on pizza. The most common (mode) preference among the k-nearest neighbors (based on age) is to be the predicted preference.
Actual Python Code
from collections import Counter
import math
def knn(data, query, k, distance_fn, choice_fn):
neighbor_distances_and_indices = []
# 3. For each example in the data
for index, example in enumerate(data):
# 3.1 Calculate the distance between the query example and the current
# example from the data.
distance = distance_fn(example[:-1], query)
# 3.2 Add the distance and the index of the example to an ordered collection
neighbor_distances_and_indices.append((distance, index))
# 4. Sort the ordered collection of distances and indices from
# smallest to largest (in ascending order) by the distances
sorted_neighbor_distances_and_indices = sorted(neighbor_distances_and_indices)
# 5. Pick the first K entries from the sorted collection
k_nearest_distances_and_indices = sorted_neighbor_distances_and_indices[:k]
# 6. Get the labels of the selected K entries
k_nearest_labels = [data[i][-1] for distance, i in k_nearest_distances_and_indices]
# 7. If regression (choice_fn = mean), return the average of the K labels
# 8. If classification (choice_fn = mode), return the mode of the K labels
return k_nearest_distances_and_indices , choice_fn(k_nearest_labels)
def mean(labels):
return sum(labels) / len(labels)
def mode(labels):
return Counter(labels).most_common(1)[0][0]
def euclidean_distance(point1, point2):
sum_squared_distance = 0
for i in range(len(point1)):
sum_squared_distance += math.pow(point1[i] - point2[i], 2)
return math.sqrt(sum_squared_distance)
def main():
'''
# Regression Data
#
# Column 0: height (inches)
# Column 1: weight (pounds)
'''
reg_data = [
[65.75, 112.99],
[71.52, 136.49],
[69.40, 153.03],
[68.22, 142.34],
[67.79, 144.30],
[68.70, 123.30],
[69.80, 141.49],
[70.01, 136.46],
[67.90, 112.37],
[66.49, 127.45],
]
# Question:
# Given the data we have, what’s the best-guess at someone’s weight if they are 60 inches tall?
reg_query = [60]
reg_k_nearest_neighbors, reg_prediction = knn(
reg_data, reg_query, k=3, distance_fn=euclidean_distance, choice_fn=mean
)
'''
# Classification Data
#
# Column 0: age
# Column 1: likes pineapple
'''
clf_data = [
[22, 1],
[23, 1],
[21, 1],
[18, 1],
[19, 1],
[25, 0],
[27, 0],
[29, 0],
[31, 0],
[45, 0],
]
# Question:
# Given the data we have, does a 33 year old like pineapples on their pizza?
clf_query = [33]
clf_k_nearest_neighbors, clf_prediction = knn(
clf_data, clf_query, k=3, distance_fn=euclidean_distance, choice_fn=mode
)
if __name__ == '__main__':
main()Source: GitHub
Explanation of the Python Code for kNN
Following is the explanation of the above Python code we used to implement k-Nearest Neighbours algorithm:
- It imports the necessary modules: ‘counter’ from the ‘collections’ module for statistics and ‘math’ for mathematical functions.
- The ‘knn’ function is defined to perform the k-NN algorithm, taking the following parameters:
- data: The dataset where each item includes features and a label.
- query: The new data point that needs to be classified or for which a prediction is required.
- k: The number of nearest neighbors to consider.
- distance_fn: The function used to calculate the distance between data points.
- choice_fn: The function to aggregate the labels of the nearest neighbors (mean for regression, mode for classification).
- The ‘mean’ function calculates the average of a list of numbers.
- The ‘mode’ function finds the most common element in a list.
- The ‘euclidean_distance’ function calculates the Euclidean distance between two points in space.
- The ‘main’ function demonstrates how the ‘knn’ function can be used for both regression and classification tasks with example datasets.
The script also includes a main guard (if name == ‘main’:) to ensure that the ‘main’ function is only executed when the script is run directly and not when it is imported as a module in another script.
Pros and Cons of k-Nearest Neighbors
The k-Nearest Neighbors (k-NN) algorithm is a simple yet powerful machine-learning technique for classification and regression. Here are its advantages and disadvantages:
Advantages:
- Simplicity: k-Nearest Neighbors is very simple and easy to understand. It doesn’t require any complex mathematical understanding to implement.
- No Model Training: k-NN is a lazy learning algorithm that doesn’t require training. The “model” is essentially the entire training dataset.
- Versatility: k-Nearest Neighbors can be used for both classification and regression problems.
- Non-Parametric: Since k-NN makes no assumptions about the underlying data distribution, it’s good for cases where the data is not normally distributed.
- Adaptability: k-NN can quickly adapt to changes in the input data since there is no explicit training phase.
- High Accuracy: k-Nearest Neighbors technique often provides high accuracy in prediction if the dataset is feature-rich and we use the the distance measure appropriately.
Disadvantages:
- Scalability: k-Nearest Neighbors can be very slow when the dataset is large, as it searches for the nearest k neighbors in the entire dataset.
- Curse of Dimensionality: k-NN performs poorly with high-dimensional data due to the curse of dimensionality (as dimensions increase, the volume of the space increases, making the available data sparse).
- Sensitive to Noisy Data: The presence of noisy features can significantly degrade the quality of the output, as k-NN relies on feature similarity.
- Imbalanced Data: In the case of imbalanced data, k-NN can be biased towards the majority class.
- Computational Cost: Every test instance requires a search through the entire training set, which can be computationally expensive, particularly when the dataset is large.
- Optimal k Value: Choosing the optimal value for k can be challenging and typically requires cross-validation.
- Distance Metric: The performance of k-NN depends on the distance metric used to find the nearest neighbors. Different metrics can give different results.
- Feature Scaling: The k-Nearest Neighbors technique requires feature scaling (normalization or standardization) because it uses distance measures. Features on larger scales can unduly influence the algorithm.
The k-NN algorithm is often a good first choice, especially when you have a small dataset, and the complex relationship between features makes it difficult for parametric methods to perform well. However, the time and memory requirements can become impractical for large datasets.
Applications for k-Nearest Neighbors Technique
The k-Nearest Neighbors (k-NN) algorithm is versatile and can be used for classification and regression tasks. Its applications span a variety of fields due to its simplicity and effectiveness in dealing with certain types of data. Here are some detailed applications of k-NN:
Medical Diagnosis:
k-NN is used to classify patients based on their similarity to other patients with known outcomes. It helps in diagnosing diseases by comparing patient records with historical data.
Recommendation Systems:
k-Nearest Neighbors (k-NN) can power recommendation engines by finding products or media similar to the user’s history. For example, it can suggest movies similar to the ones a user has rated highly by finding movies liked by similar users.
Financial Risk Analysis:
In finance, k-NN algorithms can help assess creditworthiness by comparing a loan applicant with past applicants with similar financial attributes to predict potential risk.
Image Recognition:
In computer vision, we can use k-NN for image classification. It compares new images with a database of labeled images to identify features such as faces, objects, or handwritten digits.
Pattern Recognition:
k-NN is used for recognizing patterns in data, which is useful in various domains like signal processing or bioinformatics, especially for classifying unknown patterns based on known patterns.
Stock Market Forecasting:
We can use k-NN to predict stock market trends by comparing the current market state to historical data to find similar patterns from the past.
Agriculture:
k-NN can help in precision farming, such as predicting crop yields, disease outbreaks, or soil health by comparing current conditions with historical agricultural data.
Sentiment Analysis:
In text analytics, k-NN is used to classify the sentiment of text data (positive, negative, neutral) by comparing it to a corpus of labeled sentiment data.
Intrusion Detection:
In cybersecurity, k-NN can help detect abnormal network behavior (intrusions or attacks) by comparing network traffic to known intrusion patterns.
Handwriting Detection:
k-NN can recognize handwritten digits or letters by comparing the handwritten samples to a labeled dataset.
Gene Expression Analysis:
In genomics, k-NN is used to classify different types or stages of diseases based on the expression patterns of genes.
Real Estate Valuation:
k-NN can estimate property values by finding and averaging the values of the most similar properties in terms of location, size, and features.
Conclusion
The effectiveness of k-NN in these applications is often contingent upon having a well-structured and relevant dataset, the correct choice of the ‘k’ parameter, and appropriate distance metrics to compare the features. In use cases that meet these conditions, k-NN can be a powerful tool for pattern recognition and classification in real-world scenarios.

Nisha Arya is a Data Scientist and Technical writer from London.
Having worked in the world of Data Science, she is particularly interested in providing Data Science career advice or tutorials and theory-based knowledge around Data Science. She is a keen learner seeking to broaden her tech knowledge and writing skills while helping guide others.