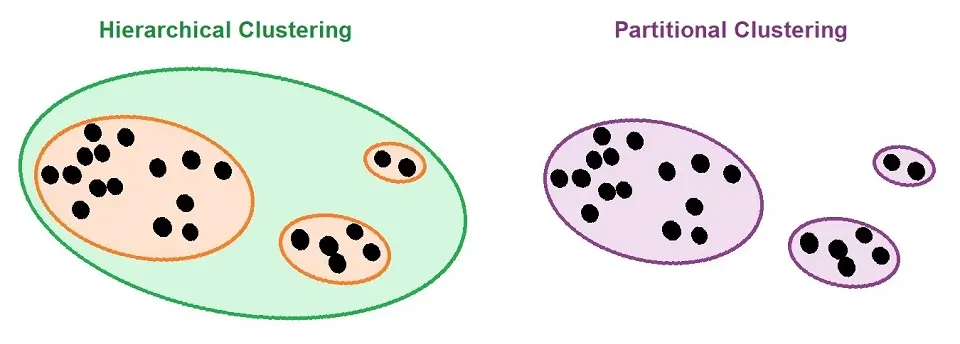
Hierarchical Clustering in Machine Learning
If you read the “An Introduction to Clustering” article, you will know that Hierarchical Clustering is a type of Connectivity model in Machine Learning.
To recap, Connectivity Models are based on the fact that data points in the same data place have similarities.
What is Hierarchical Clustering?
Hierarchical Clustering is an algorithm that groups similar data points into clusters. Hierarchical Clustering aims to produce a set of clusters where the clusters differentiate from one another, and the data points within the cluster have similarities.
To better understand Hierarchical Clustering, it will be good to know the concept of K-means clustering. To know more about this, please read the article: K-means Clustering.
How Hierarchical Clustering works
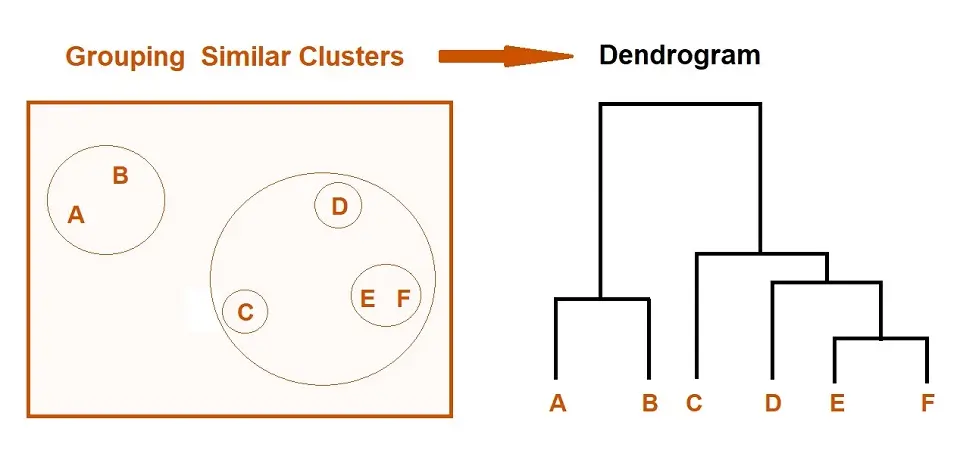
The above picture shows how we achieve Hierarchical Clustering. Now, I will go through the different types, which are Agglomerative Clustering and Divisive Clustering.
- Depending on which type of Hierarchical Clustering we use, we treat each observation as a separate cluster (Agglomerative Clustering) or formed as one big cluster (Divisive Clustering)
- It then identifies clusters dependent on the closeness (similarities) and merges these clusters.
- This iterative process will continue until the merging of clusters.
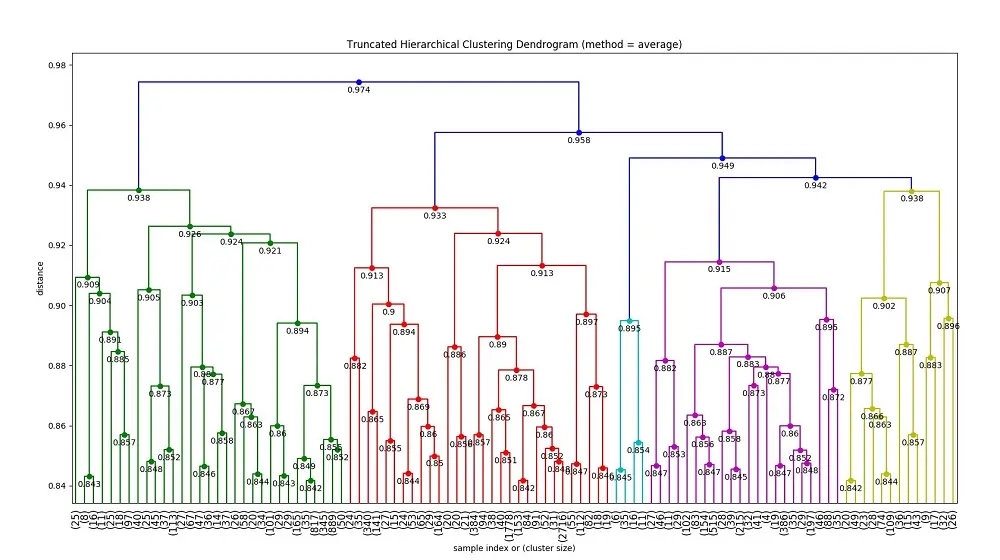
- The output is a dendrogram, showing the clusters’ relationship in a Hierarchical representation.
Types of Hierarchical Clustering
Hierarchical Clustering have following two types:
- Agglomerative Hierarchical Clustering
- Divisive Hierarchical Clustering
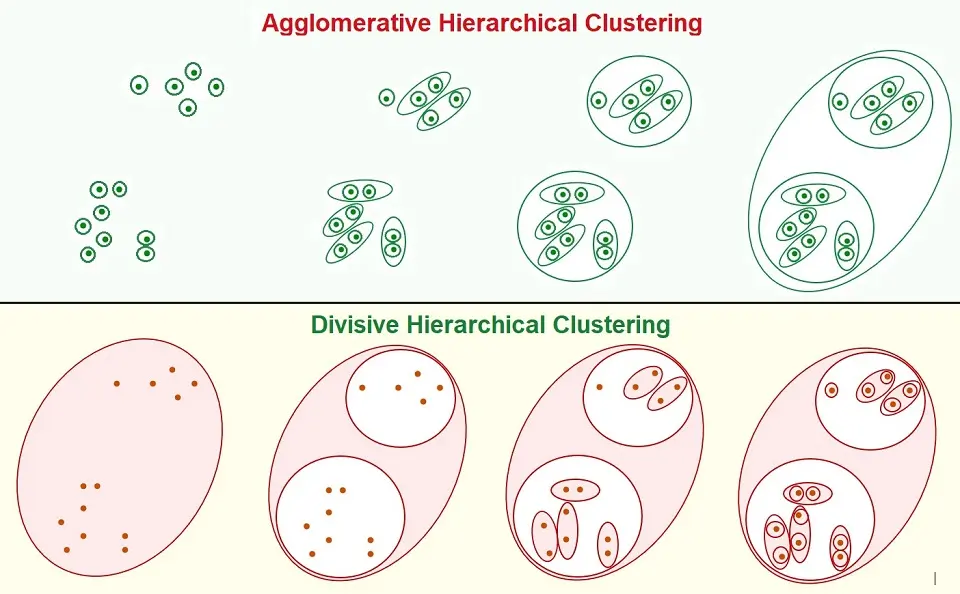
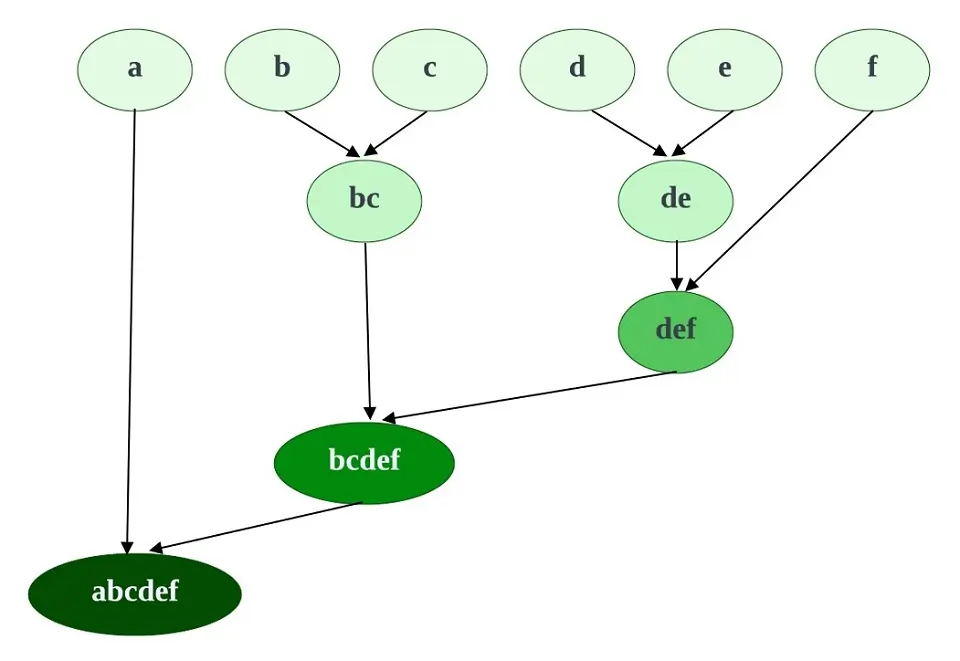
Agglomerative Hierarchical Clustering
Agglomerative Clustering is the most common type of hierarchical Clustering, which groups objects/data points into clusters based on their similarities.
How Does it work?
- We treat all data points as individual clusters.
- The two nearest neighboring clusters are then joined to form one single cluster.
- This process recursively happens until the formation of the desired number of clusters.
How do two clusters become one cluster?
Two clusters are combined based on the similarities between them. There are computational methods that are used to calculate these similarities, such as:
- The distance between the closest points in the two clusters.
- The distance between the furthest points in the two clusters.
- The average distance between all the data points in the two clusters.
- The distance between the centroids of two clusters.
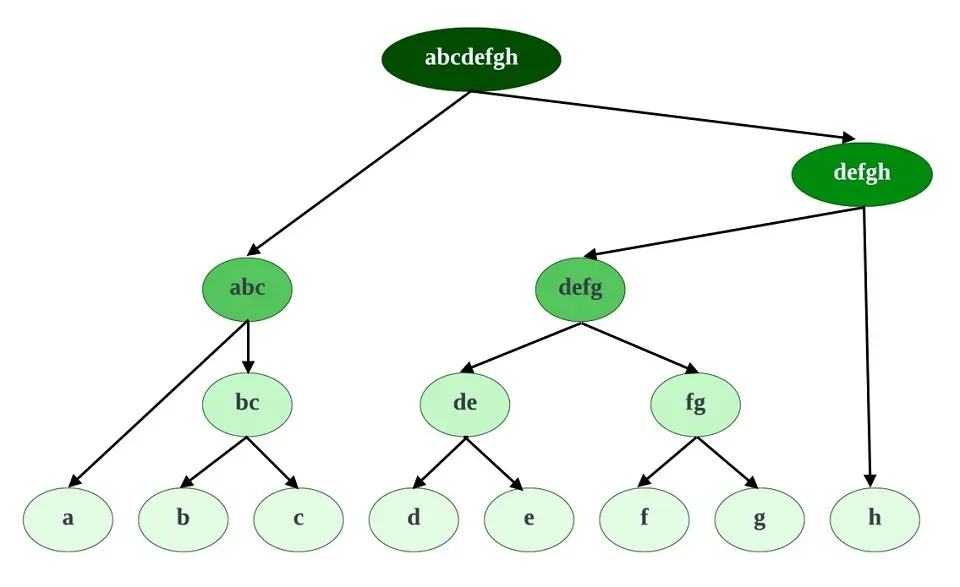
Divisive Hierarchical Clustering
Divisive Clustering is a less popular type of Hierarchical Clustering. This is a “top-down” approach where all the data points initially belong to one big cluster. Thereafter, division takes place as data points move down the hierarchy.
How does Divisive Hierarchical Clustering Work?
- All the data points are formed into one big cluster
- The big cluster is then split into two least similar clusters
- This process recursively happens until we achieve the desired number of clusters.
How to initially split the cluster?
To split the cluster, you need to check the Sum of the Squared Error (SSE) of each cluster and select the one with the largest value. The cluster with the largest SSE value separates into two clusters, forming a new cluster.
How do we split the cluster correctly?
So now we know how to split the cluster initially, how do we know that we are splitting the cluster to form two new clusters correctly? To do this, we use Ward’s method by using the difference in the SSE and finding the largest reduction to create a split.
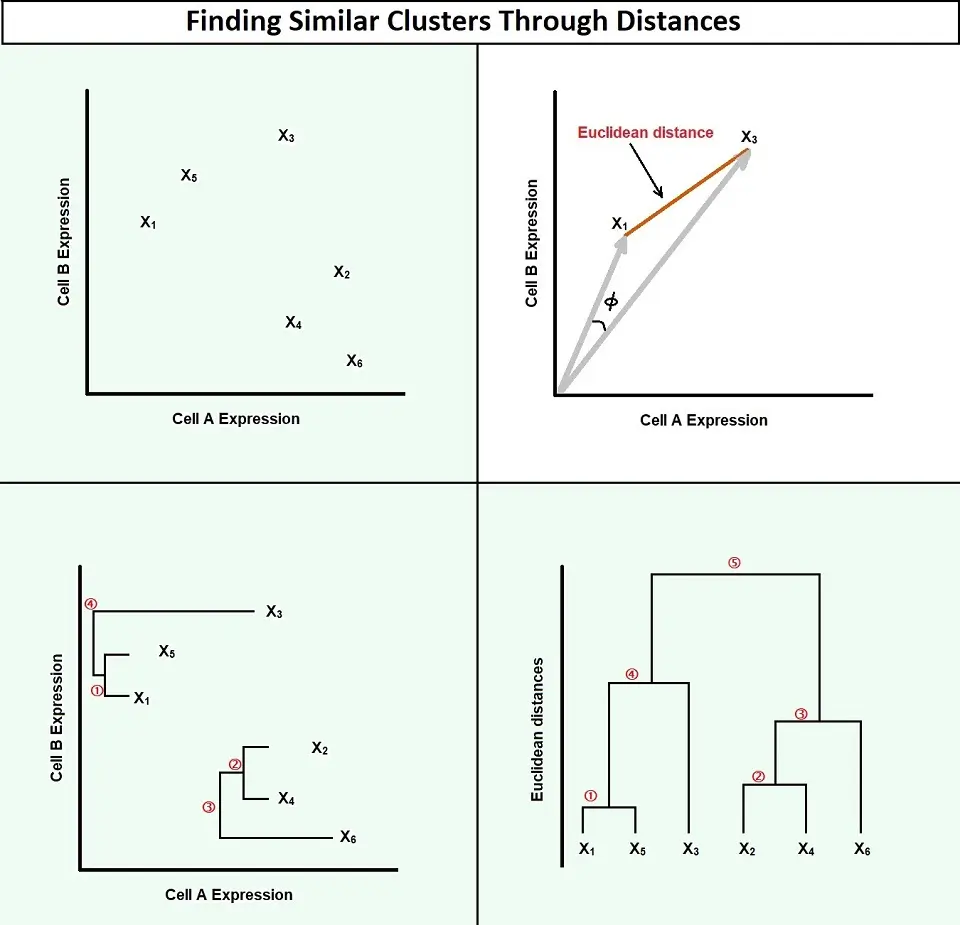
How to Measure Similarities in Clusters?
Distance Between the Clusters
One way that we measure the similarities between the clusters is through distance. There are three different types of distance approaches as follows:
- Compactness: Measurement of how close the data points are within the same cluster by the machine learning algorithm.
- Separation: The measure of how well-separated a cluster is from its neighboring cluster or other clusters.
- Connectivity: When the data points in a cluster are next to each other or highly connected.
A metric used to achieve this is Euclidean distance. Although you can use many other metrics, many people prefer to use Euclidean distance.
Euclidean distance uses a straight line drawn from one cluster to another to measure the distance between data points. It mathematically computes the root of squared differences between the coordinates between two objects.
This formula for Euclidean distance is the distance between two points, which is defined as:
- (x1 1 , y1 1 ) and (x2 2 , y2 2 ) is d = √[(x2 – x1)2 + (y2 – y1)2]
Linkage
The Linkage criterion determines the distance between a set of data points. Below are the four most popular types of linkage:
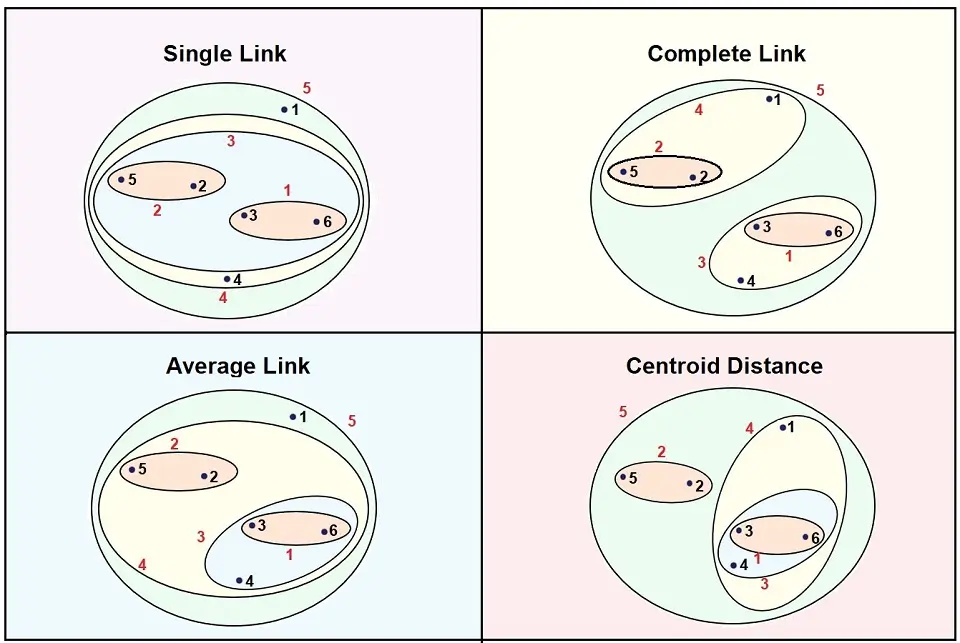
1. Single-Linkage
Single-linkage is the shortest distance between data points in two clusters. We can call this the nearest neighbor. It can produce new clusters when data points in different clusters are closer to one another than data points within their own cluster.
2. Complete-Linkage
Complete-Linkage is the furthest distance between a pair of data points in two clusters. We can call this the furthest neighbor. This type of linkage is known to produce tighter clusters. However, sometimes they can end up too close.
3. Average-Linkage
Average-Linkage is the distance between each data point pair, added up and divided by the number of pairs, giving us an average inter-cluster distance.
4. Centroid-Linkage
Centroid-Linkage is the distance between the centroids of the two clusters. As new data points are identified, the centroids move. Therefore, we may see the smaller clusters having similarities to new larger clusters, changing the dendrogram.

Nisha Arya is a Data Scientist and Technical writer from London.
Having worked in the world of Data Science, she is particularly interested in providing Data Science career advice or tutorials and theory-based knowledge around Data Science. She is a keen learner seeking to broaden her tech knowledge and writing skills while helping guide others.