Reindex, Transform, and Aggregate datasets using pandas Library
Most of the time, the dataset we will get from the business will be dirty and cannot be used straight forward to train machine learning models. Therefore, we must treat the dataset and bring it to the desired form to input it into an algorithm. This tutorial discusses reindexing, transforming, and aggregating datasets in Pandas.
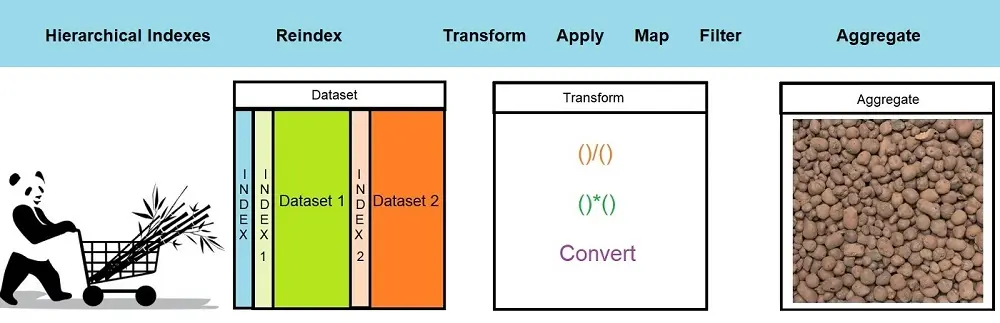
What are Reindexing, Transforming, and Aggregating?
Reindexing, transforming, and aggregating are fundamental operations performed on datasets to structure, analyze, and derive meaningful insights from data.
Reindexing involves rearranging the data based on new labels or indices, facilitating alignment and reshuffling of data for improved accessibility or conformity.
Transforming refers to the process of altering the data’s format, structure, or values, often to make it suitable for further analysis or to fit a particular model’s requirements. This can include normalization, conversion, or filling in missing values.
Aggregating encompasses the technique of summarizing or grouping data to derive consolidated metrics, like computing sums, averages, or counts over specific categories or intervals.
Together, these operations equip data analysts and scientists with tools to prepare, refine, and comprehend complex datasets efficiently.
A few important techniques/functions are commonly used and mentioned in the article Pandas: An Ultimate Library for Data Science. In this article, we will continue the discussion and explore pandas’ capabilities.
To demonstrate examples, I have taken TMDB 5000 movies dataset from Kaggle. Let’s start with an understanding of the reindex operations in pandas.
Please note that the links to the HTML file for the code and the actual code file of the Jupyter notebook for practice are at the bottom of this article.
Reindexing in pandas
Reindexing of the dataset is required when we are combining multiple datasets. To reindex, we can also specify how Panadas fills the index using the “method” argument to the “reindex” function.
# Without using any fill technique
dataSet = dataSet2.reindex(dataSet1.index)
# Using forward fill
dataSet = dataSet2.reindex(dataSet1.index, method="ffill") # Using backward fill
dataSet = dataSet2.reindex(dataSet1.index, method="bfill")
Indexes are immutable. We cannot update the index of the dataset. If we try to execute the following command, we will get an error:
tmdbDataSet.index[0] = 24654
# Output
# TypeError: Index does not support mutable operations
There is an alternative way, and we can update an index of the whole of the dataset:
import pandas as pd
tmdbDataSet = pd.read_csv('tmdb_5000_movies.csv')
tmdbDataSet.index = [x * 2 for x in range(0, 4803)] # Using comprehension list
The above code will execute successfully, as the TMDB data set has 4803 rows, and we are updating an index of all the rows.
We can also give a name to index using the command shown below:
import pandas as pd
tmdbDataSet = pd.read_csv('tmdb_5000_movies.csv') print(tmdbDataSet.index.name) # None tmdbDataSet.index.name = 'movie_index' print(tmdbDataSet.index.name) # movie_index
Hierarchical Indexes
We can even declare Hierarchical Indexes on the dataset. Hierarchical Indexes mean more than one index on the given dataset.
We need to use a “set_index” function to set multiple indexes on the dataset. We can sort the indexes created using a sort_index function as shown below:
import pandas as pd
tmdbDataSet = pd.read_csv('tmdb_5000_movies.csv')

# Adding index on release_date and homepage column tmdbDataSet_multi_index = tmdbDataSet.set_index(['release_date', 'status'])

# Sorting the index columns
tmdbDataSet_multi_index = tmdbDataSet_multi_index.sort_index()
The benefit of adding multiple indexes is that we can slice the data easily. Let’s see an example shown below:
# To get list of all movies released on 1916-09-04 print(tmdbDataSet_multi_index.loc[('1916-09-04','Released')])

# To get list of all movies released on 1916-09-04 and 2010-03-03 print(tmdbDataSet_multi_index.loc[(['1916-09-04', '2010-03-03'],'Released'), :])

# To get list of all rumored movies print(tmdbDataSet_multi_index.loc[(slice(None), 'Rumored'), :])NOTE: While creating Hierarchical Indexes or multiple indexes, we need to note the order of indexing. In the example shown above, if we need a list of rumored movies in the second index, we still need to pass the first index, as shown above. We need to use “slice(None)” to do so.
We can also swap the indexes in our dataset. Moreover, it is also possible to reset the indexing of the data set to the original.
# swapping index of multilevel index
tmdbDataSet_multi_index_swap = tmdbDataSet_multi_index.swaplevel(0,1) print(tmdbDataSet_multi_index_swap.head())

# Resetting Index
tmdbDataSet_original = tmdbDataSet_multi_index_swap.reset_index() print(tmdbDataSet_original.head())
If our dataset has multiple indexes, we can’t pivot the dataset. But we can pivot after stacking or unstacking the dataset.
Transforming data in pandas
We can even transform our data set based on our desired output. Using pandas, we can transform data using divide, multiply, convert a string to upper case, etc. Let’s look at the example shown below:
import pandas as pd
tmdbDataSet = pd.read_csv('tmdb_5000_movies.csv')

# Divide vote_average by 2 print(tmdbDataSet.vote_average.floordiv(2))

# Convert column to upper case print(tmdbDataSet.status.str.upper())

# Drop column from the dataset
tmdbDataSet_dropped = tmdbDataSet.drop(['production_countries'], axis='columns')

print(tmdbDataSet_dropped.head())
To perform an advanced-level transformation to the datasets, we can use “apply” and “transform” functions. Below is the example describing “transform” and “apply” functions.
Using “transform” Function
We can transform our dataset using the “transform” function. Let’s look at an example to understand the “transform” function in a better way:
import pandas as pd
tmdbDataSet = pd.read_csv('tmdb_5000_movies.csv') grouped_dataset = tmdbDataSet.groupby(['original_language']) def find_en_lang(series):

if series.values[0] == 'en': return 'english'
else:
return 'non-english'

tmdbDataSet.loc[:,'original_language_en'] = grouped_dataset.original_language.transform( find_en_lang)

display(tmdbDataSet.head())
In the example shown above, we are manipulating the ”original_language” column, and we are creating a new column in a dataset with values “english” or “non-english”.
Using the “apply” Function
We use the “apply” function to iterate over the pandas series. Similar to the “transform” function, we can use the “apply” function, leading to data transformation. Let’s look at an example to understand the use of the “apply” function in a better way:
import pandas as pd
tmdbDataSet = pd.read_csv('tmdb_5000_movies.csv')

## Converting runtime to hours
tmdbDataSet.loc[:,'runtime_hours'] = tmdbDataSet.apply(lambda x:x['runtime']/60, axis=1)

display(tmdbDataSet.head())
In the example shown above, we are converting the runtime of the movie, which is in minutes to hours. Also, we are using the lambda function to do so.
Difference between “transform” and “apply” functions
The key difference between “transform” and “apply” functions is:
- The “apply” function passes all the columns for each group as a DataFrame to the custom function, while “transform” passes each column for each group as a Series to the custom function.
- The custom function passed to “apply” can return a scalar, a Series, or DataFrame. The custom function passed to transform must return a sequence (a one-dimensional Series, array, or list) the same length as the group.
Using Filter function
We can also “filter” down the results and can perform the transformation on the filtered results. Let us look at an example shown below and understand it:
import pandas as pd
tmdbDataSet = pd.read_csv('tmdb_5000_movies.csv')
grouped_dataset = tmdbDataSet.groupby(['original_language'])
# Movies whose budget is greater than 25cr display(grouped_dataset.filter(lambda x: x['budget'].sum() > 250000000))
In the example shown below, we filter out the results based on language. We only want results whose sum of the budget for a specific “original_language” is more than 25cr.
Using map function
Till now, we have seen “groupby” operations being performed on the columns of the dataset. What if we want to perform “groupby” based on our condition? We can use the “map” function in such a scenario. Consider the example shown below:
import pandas as pd
tmdbDataSet = pd.read_csv('tmdb_5000_movies.csv')
language = (tmdbDataSet['original_language'] == 'en').map({True:'English',False:'Non-English'}) display(tmdbDataSet.groupby(language)['budget', 'original_language'].mean())
In the example above, we performed the “groupby” function based on our condition. We are grouping the dataset into “English” or “non-English” groups.
Aggregating dataset in Pandas
Let’s check the codes for aggregating datasets in pandas as follows;
Aggregating Based on Multiple Measures
We can also aggregate column values in the dataset. Pandas provide “agg” function, using which we can perform aggregation functions.
Consider the example shown below:
import pandas as pd
tmdbDataSet_dateIndex = pd.read_csv('./Cleaning Data/tmdb_5000_movies.csv',parse_dates=True, index_col='release_date')

# Popularity of movie depends on vote_average, revenue - budget, popularity tmdbDataSet_date_index['profit'] = tmdbDataSet_date_index['revenue'] - tmdbDataSet_date_index['budget']

tmdbDataSet_date_index_grouped = tmdbDataSet_date_index.groupby('title') tmdbDataSet_date_index_grouped_sub = tmdbDataSet_date_index_grouped[['vote_average','profit', 'popularity']]

# Max and min value in columns
agg_results = tmdbDataSet_date_index_grouped_sub.agg(['max', 'min']) print(agg_results)

# Observation
# The result depicts max and min value of each movie title
# Also you might have noticed min and max values are same. # This is because each movie title has only one row in dataset # Can you claim which movie is most popular and profitable?
Aggregating Based on Dictionary Object
Using the “agg” function, we can also aggregate our results based on the dictionary object. It means we can have different aggregation measures for different columns in the dataset. Let’s see an example:
import pandas as pd
tmdbDataSet = pd.read_csv('tmdb_5000_movies.csv')
# Extract year of release_date and set release_date column as index tmdbDataSet_agg = tmdbDataSet.copy()
tmdbDataSet_agg['year'] = pd.to_datetime(tmdbDataSet_agg['release_date']).dt.year tmdbDataSet_agg['year'] = tmdbDataSet_agg['year'].fillna(0.0).astype(int) tmdbDataSet_agg.set_index('release_date', inplace=True)
tmdbDataSet_agg['profit'] = tmdbDataSet_agg['revenue'] - tmdbDataSet_agg['budget']

def countMovies(series):
return series.count()

aggObject = {'profit':'sum', 'title': countMovies }

tmdbDataSet_grouped = tmdbDataSet_agg.groupby(['year']).agg(aggObject) # Observations
# Here we are trying to calculate no of movies released in a year
# Year which has the most profit
# Do you know in which year most of movies are released?
Let’s plot the chart to see the movie budget trend and no release over a year.
# Cleaning up the data
tmdbDataSet_grouped = tmdbDataSet_grouped.drop([0], axis='rows')

# Adding a new column as same as index column to plot scatter chart tmdbDataSet_grouped['y'] = list(tmdbDataSet_grouped.index)

# Plotting scatter chart
tmdbDataSet_grouped.plot(kind='scatter', y='y', x='profit', s=tmdbDataSet_grouped.title)

#Observations
# Do you see any trend in profit and release count over a year? # Do share your observations in comment section
Conclusion
In this post, we have extensively explored the pandas Python package. We did this with the help of an example dataset from Kaggle for reindexing, transforming, and aggregating data in Pandas. I would advise you to explore more about the dataset we have used and share your opinions in the comment section.
You can look at the code discussed in this article in this HTML file.
Also, for your practice, I am sharing the link to jupyter notebook link to jupyter notebook where you can refer to and follow along with the post. This will help to do hands-on practice for the concepts explained.

Tavish lives in Hyderabad, India, and works as a result-oriented data scientist specializing in improving the major key performance business indicators.
He understands how data can be used for business excellence and is a focused learner who enjoys sharing knowledge.